Comparison of Boosted Models on Parkinsons Prediction with Web App
In this project, I created a web application that uses three boosted classification models and Synthetic Minority Oversampling Technique (SMOTE) for predicting the maximum severity of the Parkinsons disease in patients.
Table of contents
- 00. Project Overview
- 01. Data Overview
- 02. Data Preparation
- 03. Feature Engineering
- 04. Apply Boosted Models
- 05. Summary of Best Performing Models
- 06. Model Explainability
- 07. Growth & Next Steps
- Appendix: Footnotes
Project Overview
Context
Parkinson’s disease (PD) is a disabling brain disorder that affects movements, cognition, sleep, and other normal functions. Unfortunately, there is no current cure—and the disease worsens over time. It’s estimated that by 2037, 1.6 million people in the U.S. will have Parkinson’s disease, at an economic cost approaching $80 billion. Research indicates that protein or peptide abnormalities play a key role in the onset and worsening of this disease 1.
Three tree based ensemble models are compared for predicting the categorical UPDRS rating of Parkinsons symptoms. The models compared are XGBoost, LightGBM, and CatBoost. Additionally, the data is filtered to the first 12 months of visits for improved performance and a few engineered features are added. The target shows a significant imbalance in classes and so SMOTE (Synthetic Minority Oversampling Technique) is used to balance the target for training. Model hyperparameter tuning is performed using the hyperopt package which uses Bayesian optimization for exploring the search space of hyperparameters. Lastly, the information of whether the patient was on medication during the clinical visit is compared for model performance. The medication information has many missing values but shows predictive improvement in UPDRS 1 and UPDRS 3. AUC-ROC is used as the main comparison metric between models. The categorical threshold for the probability classification is fine-tuned to optimize in favor of Recall while also looking at the highest F1 score. Recall is favored over Precision to minimize False Negatives, which could cause patients to not seek treatment sooner. While False Positives have a negative impact on a patient, because they will likely have more frequent doctors visits, it is not as negatively impactful as a “likely” Parkinson’s patient misdiagnosed as being “not at risk.”
The default model parameters with no SMOTE and no medication data gave AUC-ROC around 0.59. The best performance for UPDRS 1 is AUC-ROC of 0.796 from a CatBoost Classifier using the Hyperopt hyperparameters and the data with SMOTE applied. The best performance for UPDRS 2 is AUC-ROC of 0.881 from a CatBoost Classifier using the Hyperopt hyperparameters, with the data medication data, and with SMOTE applied. The best performance for UPDRS 3 is AUC-ROC of 0.729 from a LightGBM Classifier using the Hyperopt hyperparameters, with the data medication data, and with SMOTE applied.
Actions
- Perform EDA on the data.
- Drop the target UPDRS 4 due to high percentage of missing values.
- Add feature engineering to create aggregate features.
- Evaluate default model prediction performance.
- Tune hyperparameters.
- Narrow data to only 12 months of visits.
- Tune hyperparameters with narrow data.
- Apply SMOTE for class imbalance.
- Add “On Medication” data.
- Tune the classification threshold.
- Save best model for each UPDRS.
Results
UPDRS 1 Prediction on Test Data
- CatBoost Hyperopt SMOTE model:
- AUC: 0.796
- Recall: 0.765
- Precision: 0.864
UPDRS 2 Prediction on Test Data
- CatBoost Hyperopt SMOTE Medication model:
- AUC: 0.881
- Recall: 0.720
- Precision: 0.692
UPDRS 3 Prediction on Test Data
- LightGBM Hyperopt SMOTE Medication model:
- AUC: 0.729
- Recall: 0.781
- Precision: 0.586
Growth/Next Steps
Areas for Scientific Research
Based on the Feature Importances from the different models, some areas for scientific research are Immunoglobulin response, Transferrins, RNA cleavage, and immune response. Proteins found that are involved in these biological processes were more prevalent.
Specific proteins of more interest are:
- P06396 Gelsolin
- P01621 Immunoglobulin kappa variable 3-20
- Q9UKV8 Argonaute2
- P05060 Secretogranin-1
- P02787 Serotransferrin
- P02790 Hemopexin
Improve Model Performance
While these models perform quite well, next steps would be to try to use bigger compute power to generate and train models using the combination of protein values and peptide values. Unfortunately, on our local machine this number becomes massive and is not reasonable for training times.
Another idea is to using domain knowledge to specifically find proteins that are known to interact and generate new features from that subset. This would require an expert in Parkinsons biochemistry to know which proteins and peptides are of interest. Because there are 227 unique proteins and 968 unique peptides, the amount of research into each protein and peptide would not be doable by a hobbyist.
Web Application
Parkinson’s Web Application Link
Github Repo
View the Github Repo here: Parkinson’s Github Repo
Data Overview:
All of the data are from a Kaggle competition that began on February 16, 2023 and ended on May 18, 2023. The core of the dataset consists of protein abundance values derived from mass spectrometry readings of cerebrospinal fluid (CSF) samples gathered from several hundred patients 2. As well, there is a column indicating whether the patient was taking any medication during the UPDRS assessment. This can affect motor function scores and is represented in the column “upd23b_clinical_state_on_medication.”
Dimensional Columns:
- patient_id: a unique identifier for each patient.
- visit_month: relative to the first visit, the number of months later for the current visit.
- visit_id: a combination of the patient_id and the visit_month. Join key for protein and patient data.
All protein only mass spectrometry data is signified by the column having only the UniProt label for the protein with the column values being the protein abundance.
All peptide mass spectrometry data is signified by the protein UniProt labeled concatenated to peptide sequence with an underscore as the separator.
Metric Columns:
- protein UniProt label: contains the mass spectrometry protein abundance.
- UniProt_peptide label: contains the mass spectrometry for the peptide abundance.
- Upd23b_clinical_state_on_medication: whether the patient was on medication during the visit.
- Values can be “On”, “Off”, or NaN if unknown.
Data Statistics:
-
248 Patients
-
968 Unique Peptides
-
227 Unique Proteins
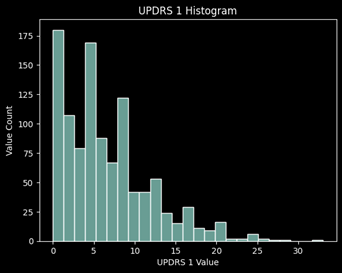
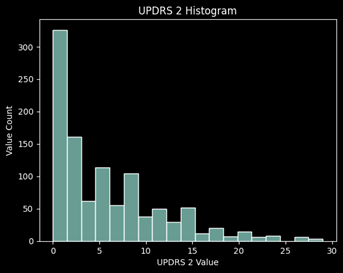
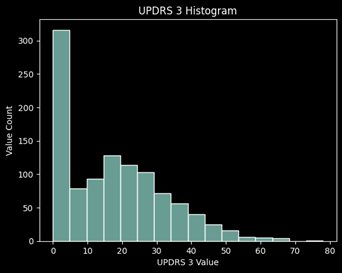
Distribution of Values
Data Preparation:
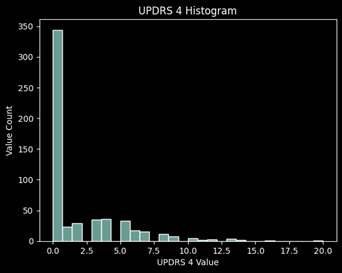
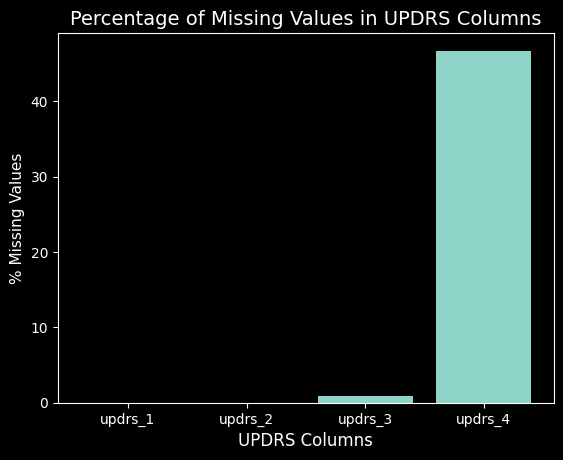
Remove UPDRS 4 from the Experiment
Looking at the missing values for each UPDRS, roughly 45% of the values are missing for UPDRS 4 which concludes me to remove this target from the prediction. It is primarily 0’s and has almost half of the values missing, thus it will not be a good target to learn from and predict.
Convert the Target from a Continuous Value to a Catgorical Value
Rather than use a continous value as the target, binning the values into different categories of severity provides a better signal of eventual outcome. Use the range of values for severity given from Wikipedia 3
| UPDRS 1 | Min | Max |
|---|---|---|
| Mild | 0 | 10 |
| Moderate | 11 | 21 |
| Severe | 22 | 52 |
| UPDRS 2 | Min | Max |
|---|---|---|
| Mild | 0 | 12 |
| Moderate | 13 | 29 |
| Severe | 30 | 52 |
| UPDRS 3 | Min | Max |
|---|---|---|
| Mild | 0 | 32 |
| Moderate | 33 | 58 |
| Severe | 59 | 132 |
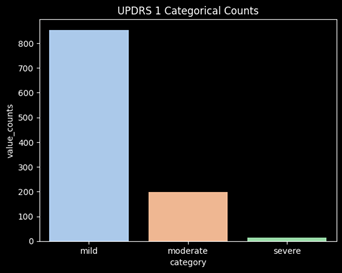
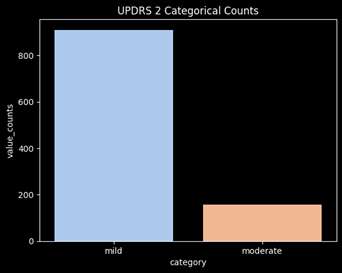
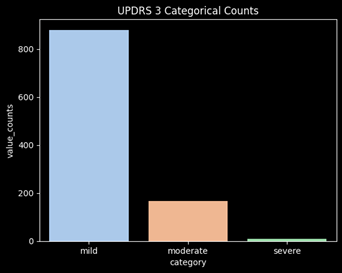
Combine the Moderate and Severe Categories
After converting the targets into categories, there is significant class imbalance of the targets. The category “severe” is barely represented and will not perform well in a ML model. In order to adjust for this issue, moderate and severe will be combined into a single category. This will mean the model will now be determining whether a user will have mild vs non-mild symptoms (moderate/severe).
Feature Engineering
Number of Visits:
- Since a patient who is experiencing more symptoms may be visiting the doctor more frequently, the number of visits was added as a feature.
Number of proteins with value > 0:
- Perhaps the number of proteins expressed has an effect on the parkinson’s symptoms
Number of peptides with value > 0:
- Perhaps the number of peptides expressed has an effect on the parkinson’s symptoms
Number of proteins and peptides with value > 0:
- Perhaps the number of proteins expressed has an effect on the parkinson’s symptoms
Protein X Protein
- Combinations of protein values multiplied by each other was implemented on the data. Because this grew the number of features exponentially, it meant the training time for the model was far too long for any benefit. The correlation values of the protein x protein columns to the UPDRS values were not showing that there was a benefit to using the engineered feature. As well, the data explodes to 51,302 protein x protein combinations.
Apply Boosted Models
With the high number of features (proteins and peptides) and low correlation of the features to the target, a decision tree based model seemed to be a good option. Decision tree based models do not require feature selection preprocessing. Using a Random Forest with boosting typically provides the best performance. The Random Forest is an ensemble model of Decision Trees which typically generalizes well when the trees are low depth. The boosting helps the Random Forest learn from the samples that it got wrong in the previous trees.
LightGBM
A gradient boosting ensemble model that grows leaf-wise, meaning only a single leaf is split when considering the gain. Leafwise growth can lead to overfitting and is best controlled by tuning the max tree depth. LightGBM uses histogram binning of data for determining splits. This can be controlled by parameters max_bin and min_data_in_bin. One key feature of LightGBM is the speed of training a model 4. This performance comes mainly from exclusive feature bundling. The gradient boosting is expressed in the GOSS (Gradient One-Sided Sampling) which gives higher weights to the data points with larger gradients 5.
XGBoost
XGBoost or extreme gradient boosting uses depth wise growth for its trees. It uses CART (classification and regression trees) to score each leaf 6. Sampling is simple bootstrap sampling with no weights used in splitting.
CatBoost
A gradient boosting ensemble model that has specific benefits for categorical features. It does not require the user to preprocess the categorical features. The CatBoost model grows the Decision Trees symmetrically, meaning that at every depth level all of the nodes use the same split condition 7. For splitting, the model uses Minimal Variance Sampling, which is performed at the tree level and optimizes the split scoring accuracy 8.
Default Model Performance
Using 5 fold Cross Validation and taking the mean results of each the 5 holdout sets for default hyperparameters for each model.
UPDRS 1
| Model | AUC | Accuracy | Precision | Recall | F1 |
|---|---|---|---|---|---|
| XGBoost | 0.598 | 0.825 | 0.705 | 0.220 | 0.335 |
| LigthtGBM | 0.582 | 0.822 | 0.736 | 0.181 | 0.290 |
| CatBoost | 0.542 | 0.813 | 0.793 | 0.090 | 0.159 |
UPDRS 2
| Model | AUC | Accuracy | Precision | Recall | F1 |
|---|---|---|---|---|---|
| XGBoost | 0.576 | 0.869 | 0.825 | 0.159 | 0.266 |
| LigthtGBM | 0.580 | 0.872 | 0.847 | 0.165 | 0.276 |
| CatBoost | 0.543 | 0.863 | 0.850 | 0.088 | 0.160 |
UPDRS 3
| Model | AUC | Accuracy | Precision | Recall | F1 |
|---|---|---|---|---|---|
| XGBoost | 0.590 | 0.854 | 0.750 | 0.193 | 0.307 |
| LigthtGBM | 0.593 | 0.858 | 0.839 | 0.193 | 0.314 |
| CatBoost | 0.557 | 0.847 | 0.834 | 0.119 | 0.208 |
Hyperparameter Tuning
Hyperparameter Optimization Using Hyperopt
Using 5 fold Cross Validation and taking the mean results of each the 5 holdout sets for best hyperparameters from the tuning package hyperopt for each model.
UPDRS 1
| Model | AUC | Accuracy | Precision | Recall | F1 |
|---|---|---|---|---|---|
| XGBoost | 0.623 | 0.803 | 0.516 | 0.323 | 0.397 |
| LigthtGBM | 0.566 | 0.797 | 0.485 | 0.180 | 0.263 |
| CatBoost | 0.566 | 0.815 | 0.685 | 0.150 | 0.246 |
UPDRS 2
| Model | AUC | Accuracy | Precision | Recall | F1 |
|---|---|---|---|---|---|
| XGBoost | 0.617 | 0.864 | 0.599 | 0.266 | 0.368 |
| LigthtGBM | 0.569 | 0.851 | 0.518 | 0.169 | 0.255 |
| CatBoost | 0.583 | 0.861 | 0.610 | 0.186 | 0.285 |
UPDRS 3
| Model | AUC | Accuracy | Precision | Recall | F1 |
|---|---|---|---|---|---|
| XGBoost | 0.619 | 0.859 | 0.728 | 0.257 | 0.380 |
| LigthtGBM | 0.617 | 0.854 | 0.666 | 0.260 | 0.374 |
| CatBoost | 0.586 | 0.836 | 0.524 | 0.208 | 0.298 |
Hyperopt Conclusion:
The hyperparameter optimization showed an improvement mainly for XGBoost across each UPDRS.
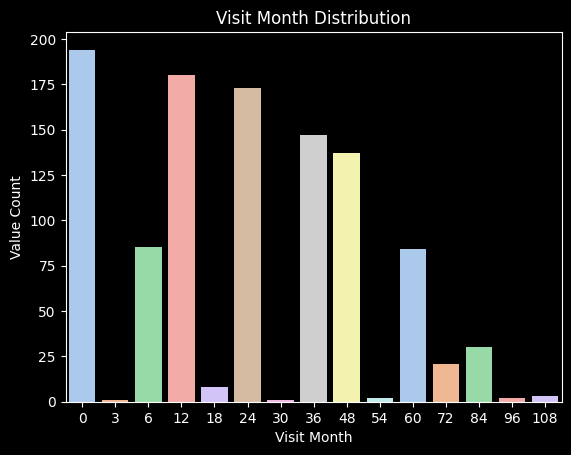
12 Months of Protein and Peptide Data
The distribution of visit months is most high in the 0 to 24 range. Perhaps the later visit months are actually only adding noise because the protein changes have already happened and may have a delayed effect on the symptoms.
UPDRS Categorical Max Values in the First 12 Months
-
UPDRS 1: 58.9% of the patients with max diagnosis of Parkinson’s get it in 12 months
-
UPDRS 2: 50% of the patients with max diagnosis of Parkinson’s get it in 12 months
-
UPDRS 3: 47% of the patients with max diagnosis of Parkinson’s get it in 12 months
Approximately 50% of the patients who get Parkinson’s diagnosis get it within the first 12 months of visits. This shows that the first 12 months may give more valuable data in terms of the categorical target.
Prediction of Max Categorical Value using 12 Month Data
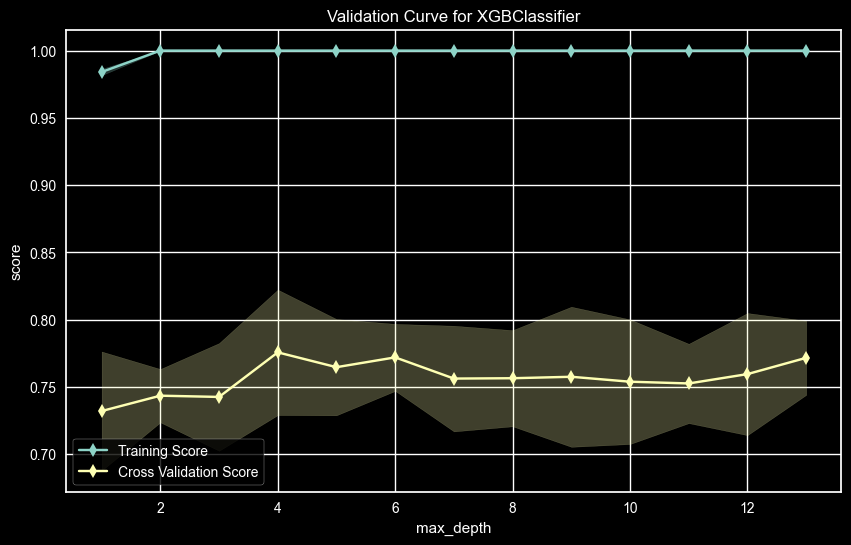
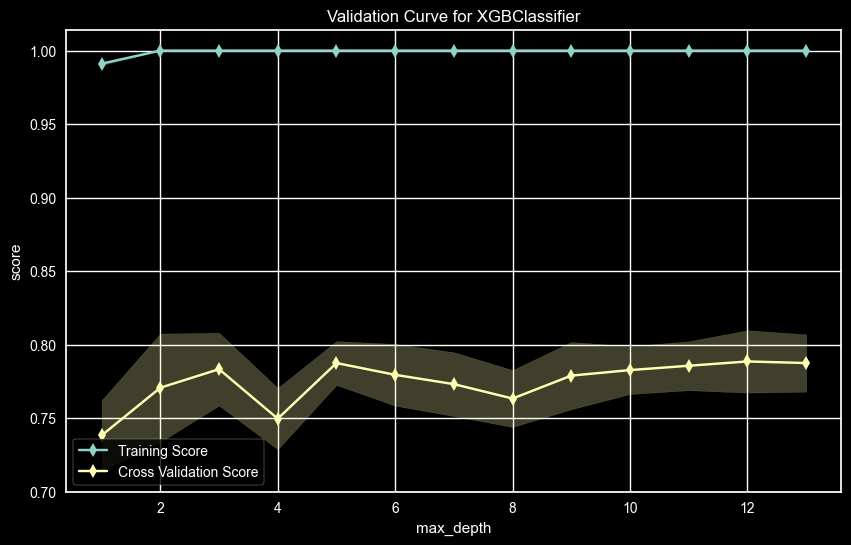
Validation curves for the hyperparameters Max Depth and Subsample were tried for finding the optimal values of the hyperparameters. These two hyperparameters tend to have a large impact on the performance, so testing them manually gives more intuition on their effect. The validation curve was measured using the metric AUC-ROC.
UPDRS 1 – Max Depth Validation Curve
The UPDRS 1 AUC score for the validation curve for Max Depth showed a high value at max_depth = 6 and 8, Since 6 is lower and should be better for generalization, the Max Depth used was 6.
UPDRS 2 – Max Depth Validation Curve
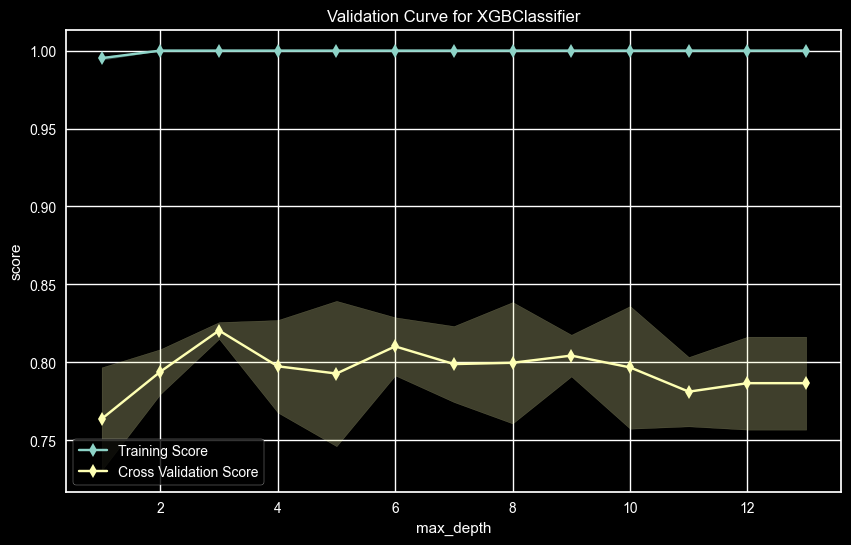
The UPDRS 2 AUC score for the validation curve for Max Depth showed a high value at max_depth = 5
UPDRS 3 – Max Depth Validation Curve
The UPDRS 3 AUC score for Max Depth the value of max_depth = 4 will be used even though the best AUC was max_depth = 8. But since the AUC values are close and max depth 4 will be better at generalizing, it will be used.
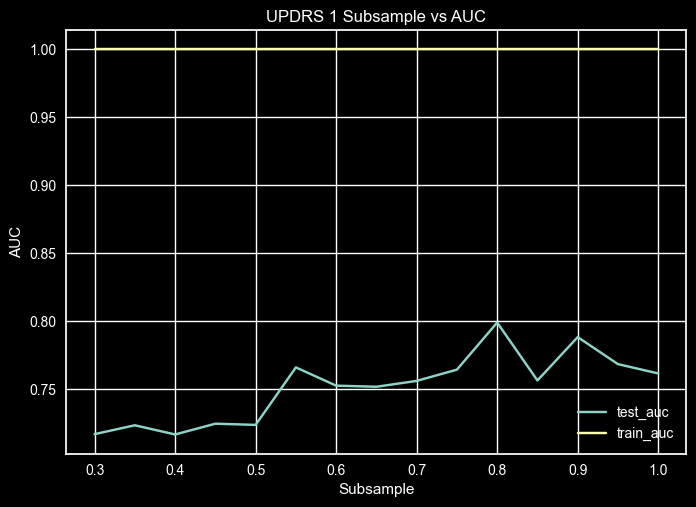
UPDRS 1 - Subsample Validation Curve
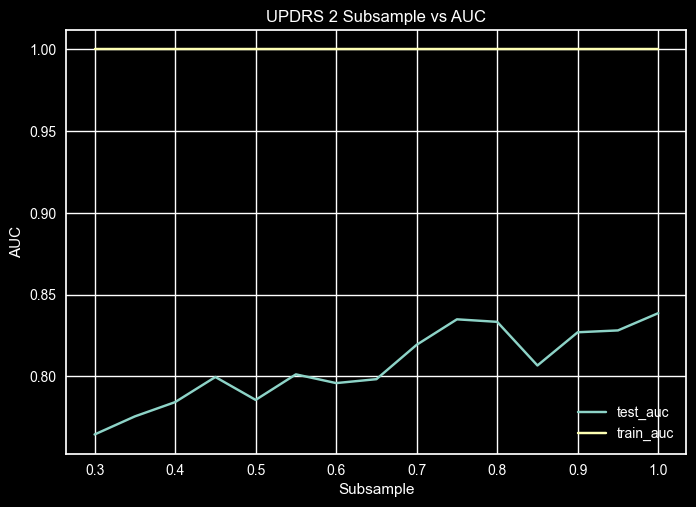
UPDRS 2 – Subsample Validation Curve
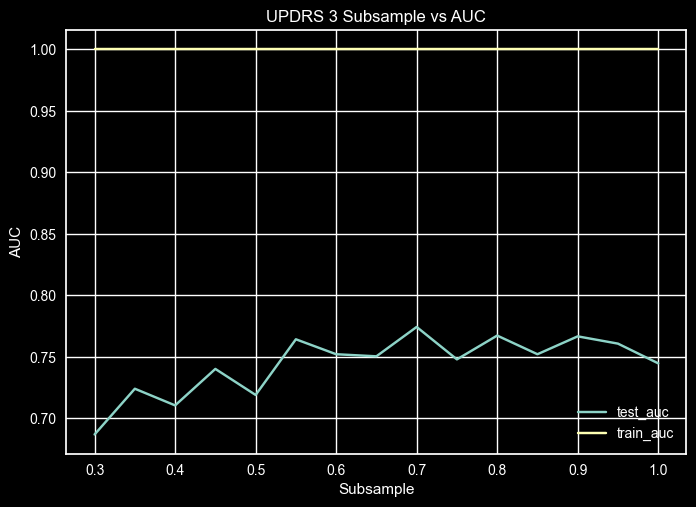
UPDRS 3 – Subsample Validation Curve
Fine Tuned Hyperparameter Comparison for XGBoost
UPDRS 1
| Hyperparam Opt | AUC | Accuracy | Precision | Recall | F1 |
|---|---|---|---|---|---|
| Default | 0.696 | 0.727 | 0.707 | 0.532 | 0.607 |
| Max Depth | 0.696 | 0.727 | 0.707 | 0.530 | 0.605 |
| Scale Pos Wt | 0.693 | 0.725 | 0.706 | 0.529 | 0.604 |
| Subsample | 0.670 | 0.702 | 0.671 | 0.503 | 0.575 |
UPDRS 2
| Hyperparam Opt | AUC | Accuracy | Precision | Recall | F1 |
|---|---|---|---|---|---|
| Default | 0.671 | 0.764 | 0.694 | 0.424 | 0.526 |
| Max Depth | 0.663 | 0.765 | 0.718 | 0.396 | 0.510 |
| Scale Pos Wt | 0.716 | 0.791 | 0.730 | 0.518 | 0.606 |
| Subsample | 0.716 | 0.791 | 0.730 | 0.518 | 0.606 |
UPDRS 3
| Hyperparam Opt | AUC | Accuracy | Precision | Recall | F1 |
|---|---|---|---|---|---|
| Default | 0.670 | 0.710 | 0.698 | 0.485 | 0.572 |
| Max Depth | 0.656 | 0.859 | 0.728 | 0.257 | 0.380 |
| Scale Pos Wt | 0.669 | 0.702 | 0.657 | 0.515 | 0.577 |
| Subsample | 0.677 | 0.705 | 0.649 | 0.544 | 0.592 |
By using only the 12 months of data to forecast for the max UPDRS value, the default hyperparameters for XGBoost show a significant improvement compared to using all of the visit months data.
The default hyperparameters perform quite well for XGBoost. When trying to optimize some of the hyperparameters manually, there is not much improvement except in the UPDRS 2. This mainly came from using the scale_pos_weight to balance out the target values.
Hyperopt Hyperparameter Tuning
Hyperopt is a python package for hyperparameter tuning that uses the algorithm Tree-based Parzen Estimators (TPE)9 to explore a search space of hyperparameter values and minimize a function, such as AUC score 10. This hyperparameter tuning package allows for a faster way to cover combinations of hyperparameters that should improve performance.
XGBoost Hyperparameters to Tune11
-
max_depth: the maximum depth of a tree. Deep trees can lead to overfitting while shallow trees may not predict as well. Tuning to find the minimum depth, meaning low variance, but with good performance on the evaluation metric.
-
min_child_weight: the minimum sum of instance weight in a child. If the weight is larger, then the model will generalize better.
-
subsample: ratio of data sampled for each decision tree. Where 0.5 means, half the training data will be sampled prior to creating the decision tree.
-
colsample_bytree: the ratio of columns sampled for each decision tree. The default is 1, which means that all columns are used. By adjusting this ratio, it can create more weak learner trees by randomly excluding some of the columns on each tree.
-
reg_alpha: L1 (Lasso) regularization on the terms. A higher alpha means a more generalized model.
-
reg_lambda: L2 (Ridge) regularization on the terms. A higher lambda means a more generalized model.
-
gamma: the minimum loss reduction needed to make a partition on a leaf node. The larger gamma is the more shallow a tree will be and the more generalized the model.
-
learning_rate: step wise shrinkage of the feature weights at each of the boosting steps. This prevents overfitting by decreasing the variance of the model. The default value is 0.3
-
max_delta_step: the maximum delta step each leaf is allowed. This can help when there is class imbalance in the data.
LightGBM Hyperparameters to Tune12
-
max_depth: default is -1, which means no limit.
-
min_data_in_leaf: default is 20. Minimum number of data in a leaf. This can reduce overfitting on the training data.
-
bagging_freq: default is 0, which means no bagging. Values greater than 0 are the number of iterations before a new sample with the bagging fraction of the total data is taken.
-
bagging_fraction: default is 1.0. This is similar to feature fraction but will randomly select part of data without resampling. This can be used to speed up training and reduce overfitting.
-
tree_learner: default is serial, which is a single machine tree learner. The options are serial, feature, data, voting.
-
is_unbalance: set to true if the training data is unbalanced. Default is false.
-
boosting: gbdt, rf, and dart. Default is gbdt.
-
lambda_l1: L1 (Lasso) regularization.
-
lamdba_l2: L2 (Ridge) regularization.
-
feature_fraction: the ratio of features to use on each tree. Default is 1.0.
-
learning_rate: default is 0.1. This is the shrinkage rate.
-
max_delta_step: default is 0.0. The final max output of leaves is learning_rate * max_delta_step. Used to limit the output of leaves.
CatBoost Hyperparameters to Tune13
-
depth: the max depth of a tree.The default is 6.
-
learning_rate: shrinkage used in updates. The default value is selected automatically for binary classification with other parameters set to default. In all other cases default is 0.03
-
bagging_temperature: The higher the value the more aggressive the bagging is. Default is None.
-
min_data_in_leaf: the minimum data required in a leaf node for a split. Default is None.
-
l2_leaf_reg: L2 (Ridge) regularization. Default is None
Hyperopt Hyperparameter Tuning Results
UPDRS 1
| Model | AUC | Accuracy | Precision | Recall | F1 |
|---|---|---|---|---|---|
| XGBoost | 0.701 | 0.728 | 0.691 | 0.563 | 0.620 |
| LigthtGBM | 0.673 | 0.696 | 0.628 | 0.561 | 0.593 |
| CatBoost | 0.566 | 0.815 | 0.685 | 0.150 | 0.246 |
UPDRS 2
| Model | AUC | Accuracy | Precision | Recall | F1 |
|---|---|---|---|---|---|
| XGBoost | 0.723 | 0.752 | 0.712 | 0.549 | 0.620 |
| LigthtGBM | 0.666 | 0.700 | 0.528 | 0.577 | 0.551 |
| CatBoost | 0.583 | 0.861 | 0.610 | 0.186 | 0.295 |
UPDRS 3
| Model | AUC | Accuracy | Precision | Recall | F1 |
|---|---|---|---|---|---|
| XGBoost | 0.702 | 0.746 | 0.702 | 0.560 | 0.623 |
| LigthtGBM | 0.697 | 0.724 | 0.674 | 0.576 | 0.621 |
| CatBoost | 0.586 | 0.836 | 0.524 | 0.208 | 0.298 |
SMOTE
By using Synthetic Minority Oversampling on the UPDRS values for the training data, the predictive ability was improved significantly. As well, by fine-tuning the threshold cutoff for the classification, the recall and precision can be optimized.
UPDRS 1 Training data:
- Class 0: 225 samples
- Class 1: 225 samples
UPDRS 2 Training data:
- Class 0: 255 samples
- Class 1: 255 samples
UPDRS 3 Training data:
- Class 0: 227 samples
- Class 1: 227 samples
Overall SMOTE Results (Default Threshold):
UPDRS 1
| Model | AUC | Accuracy | Precision | Recall | F1 |
|---|---|---|---|---|---|
| XGBoost | 0.679 | 0.675 | 0.650 | 0.764 | 0.702 |
| LigthtGBM | 0.699 | 0.696 | 0.714 | 0.646 | 0.678 |
| CatBoost | 0.722 | 0.717 | 0.699 | 0.771 | 0.733 |
UPDRS 2
| Model | AUC | Accuracy | Precision | Recall | F1 |
|---|---|---|---|---|---|
| XGBoost | 0.823 | 0.821 | 0.805 | 0.847 | 0.825 |
| LigthtGBM | 0.767 | 0.765 | 0.783 | 0.734 | 0.758 |
| CatBoost | 0.825 | 0.821 | 0.837 | 0.801 | 0.819 |
UPDRS 3
| Model | AUC | Accuracy | Precision | Recall | F1 |
|---|---|---|---|---|---|
| XGBoost | 0.708 | 0.706 | 0.662 | 0.838 | 0.740 |
| LigthtGBM | 0.725 | 0.727 | 0.770 | 0.648 | 0.704 |
| CatBoost | 0.724 | 0.722 | 0.750 | 0.673 | 0.709 |
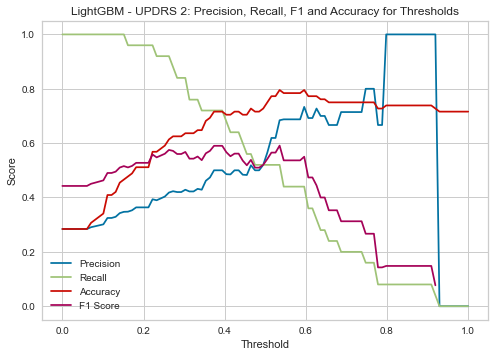
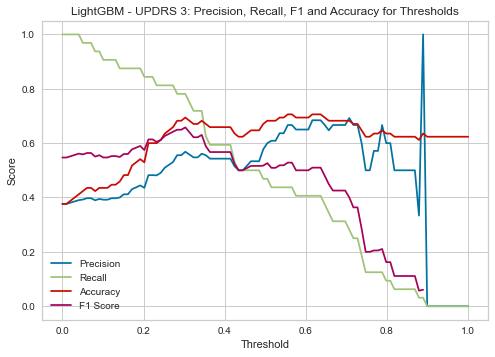
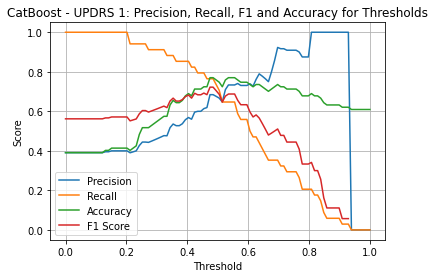
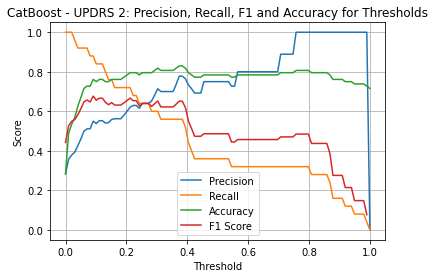
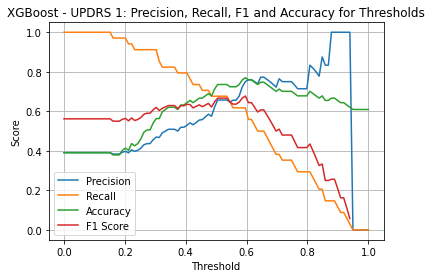
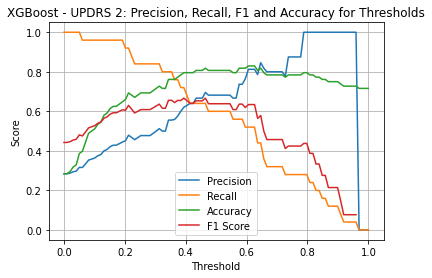
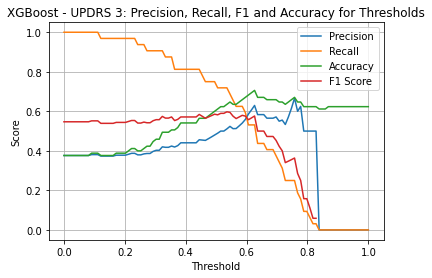
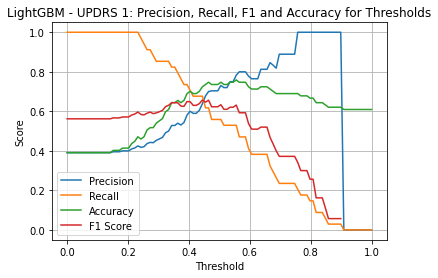
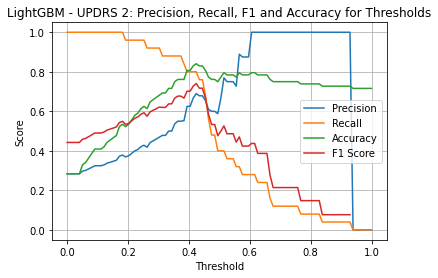
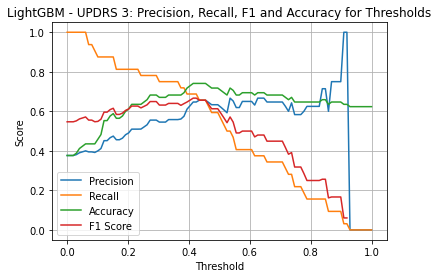
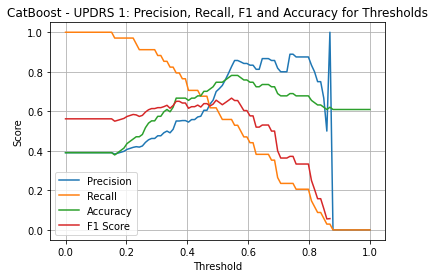
Fine-Tuning the Threshold
By adjusting the classification threshold cutoff for each of the models, the recall and precision can be optimized for the performance needs.
Threshold for SMOTE Trained Models (No Medication Data)
XGBoost UPDRS 1
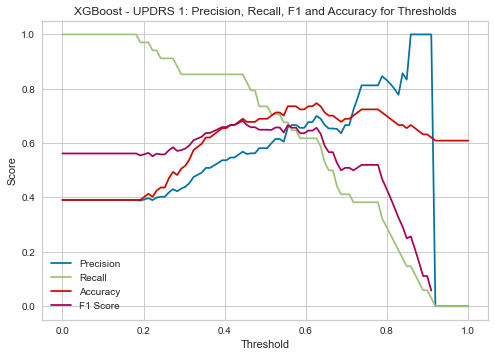
| Threshold | AUC | Accuracy | Precision | Recall |
|---|---|---|---|---|
| 0.4 | 0.750 | 0.655 | 0.537 | 0.853 |
XGBoost UPDRS 2
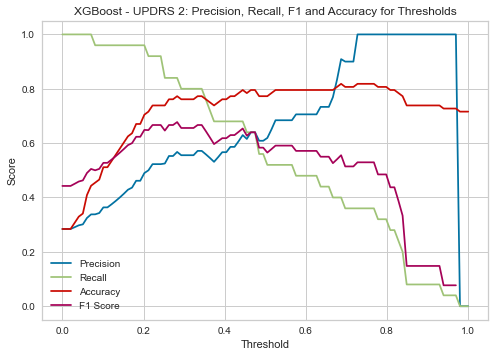
| Threshold | AUC | Accuracy | Precision | Recall |
|---|---|---|---|---|
| 0.17 | 0.860 | 0.636 | 0.436 | 0.960 |
XGBoost UPDRS 3
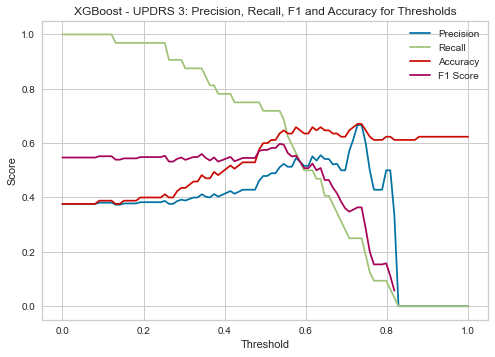
| Threshold | AUC | Accuracy | Precision | Recall |
|---|---|---|---|---|
| 0.15 | 0.643 | 0.388 | 0.378 | 0.969 |
LightGBM UPDRS 1
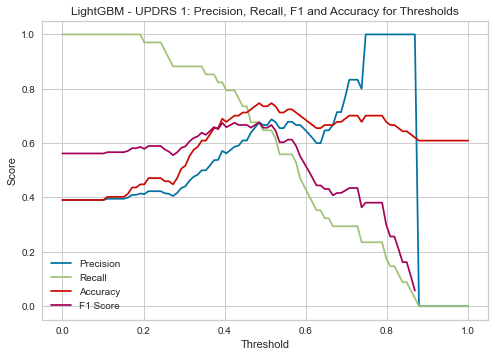
| Threshold | AUC | Accuracy | Precision | Recall |
|---|---|---|---|---|
| 0.4 | 0.759 | 0.690 | 0.571 | 0.824 |
LightGBM UPDRS 2
| Threshold | AUC | Accuracy | Precision | Recall |
|---|---|---|---|---|
| 0.38 | 0.785 | 0.716 | 0.500 | 0.720 |
LightGBM UPDRS 3
| Threshold | AUC | Accuracy | Precision | Recall |
|---|---|---|---|---|
| 0.30 | 0.703 | 0.694 | 0.568 | 0.781 |
CatBoost UPDRS 1
| Threshold | AUC | Accuracy | Precision | Recall |
|---|---|---|---|---|
| 0.48 | 0.796 | 0.770 | 0.684 | 0.765 |
CatBoost UPDRS 2
| Threshold | AUC | Accuracy | Precision | Recall |
|---|---|---|---|---|
| 0.21 | 0.865 | 0.795 | 0.621 | 0.720 |
CatBoost UPDRS 3
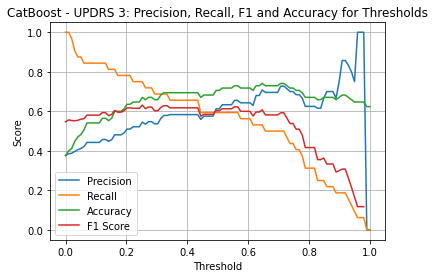
| Threshold | AUC | Accuracy | Precision | Recall |
|---|---|---|---|---|
| 0.25 | 0.718 | 0.659 | 0.533 | 0.750 |
Use Patient Medical Data along with Hyperopt Params and SMOTE
There is data on whether the patient was on medication during the clinical visit. This can affect the value of the UPDRS score.
Overall Results with medication data included (Default Threshold):
UPDRS 1
| Model | AUC | Accuracy | Precision | Recall | F1 |
|---|---|---|---|---|---|
| XGBoost | 0.727 | 0.721 | 0.692 | 0.804 | 0.744 |
| LigthtGBM | 0.737 | 0.734 | 0.761 | 0.680 | 0.718 |
| CatBoost | 0.767 | 0.764 | 0.771 | 0.756 | 0.763 |
UPDRS 2
| Model | AUC | Accuracy | Precision | Recall | F1 |
|---|---|---|---|---|---|
| XGBoost | 0.823 | 0.819 | 0.805 | 0.845 | 0.825 |
| LigthtGBM | 0.808 | 0.807 | 0.828 | 0.768 | 0.797 |
| CatBoost | 0.848 | 0.845 | 0.854 | 0.832 | 0.843 |
UPDRS 3
| Model | AUC | Accuracy | Precision | Recall | F1 |
|---|---|---|---|---|---|
| XGBoost | 0.712 | 0.711 | 0.667 | 0.834 | 0.741 |
| LigthtGBM | 0.725 | 0.726 | 0.776 | 0.648 | 0.706 |
| CatBoost | 0.717 | 0.715 | 0.739 | 0.678 | 0.707 |
Threshold for SMOTE Trained Models (No Medication Data)
XGBoost UPDRS 1
| Threshold | AUC | Accuracy | Precision | Recall |
|---|---|---|---|---|
| 0.5 | 0.750 | 0.724 | 0.639 | 0.676 |
XGBoost UPDRS 2
| Threshold | AUC | Accuracy | Precision | Recall |
|---|---|---|---|---|
| 0.33 | 0.853 | 0.716 | 0.5 | 0.8 |
XGBoost UPDRS 3
| Threshold | AUC | Accuracy | Precision | Recall |
|---|---|---|---|---|
| 0.52 | 0.676 | 0.624 | 0.5 | 0.72 |
LightGBM UPDRS 1
| Threshold | AUC | Accuracy | Precision | Recall |
|---|---|---|---|---|
| 0.35 | 0.768 | 0.644 | 0.528 | 0.824 |
LightGBM UPDRS 2
| Threshold | AUC | Accuracy | Precision | Recall |
|---|---|---|---|---|
| 0.42 | 0.856 | 0.830 | 0.667 | 0.8 |
LightGBM UPDRS 3
| Threshold | AUC | Accuracy | Precision | Recall |
|---|---|---|---|---|
| 0.28 | 0.729 | 0.682 | 0.556 | 0.781 |
CatBoost UPDRS 1
| Threshold | AUC | Accuracy | Precision | Recall |
|---|---|---|---|---|
| 0.36 | 0.769 | 0.655 | 0.540 | 0.794 |
CatBoost UPDRS 2
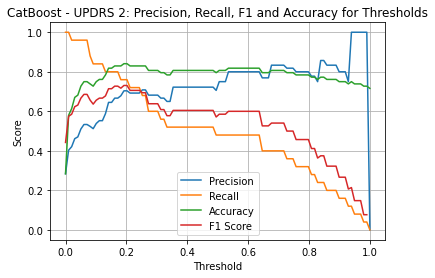
| Threshold | AUC | Accuracy | Precision | Recall |
|---|---|---|---|---|
| 0.22 | 0.881 | 0.830 | 0.692 | 0.720 |
CatBoost UPDRS 3
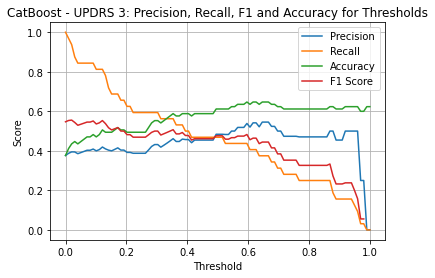
| Threshold | AUC | Accuracy | Precision | Recall |
|---|---|---|---|---|
| 0.13 | 0.587 | 0.494 | 0.410 | 0.781 |
Summary of Best Performing Models
UPDRS 1 Prediction on Test Data
- CatBoost Hyperopt SMOTE model:
- AUC: 0.796
- Recall: 0.765
- Precision: 0.864
UPDRS 2 Prediction on Test Data
- CatBoost Hyperopt SMOTE Medication model:
- AUC: 0.881
- Recall: 0.720
- Precision: 0.692
UPDRS 3 Prediction on Test Data
- LightGBM Hyperopt SMOTE Medication model:
- AUC: 0.729
- Recall: 0.781
- Precision: 0.586
Model Explainability
By looking at the Feature Importances for the top ten features, there are some interesting areas for further research.
UPDRS 1 Top Ten Features
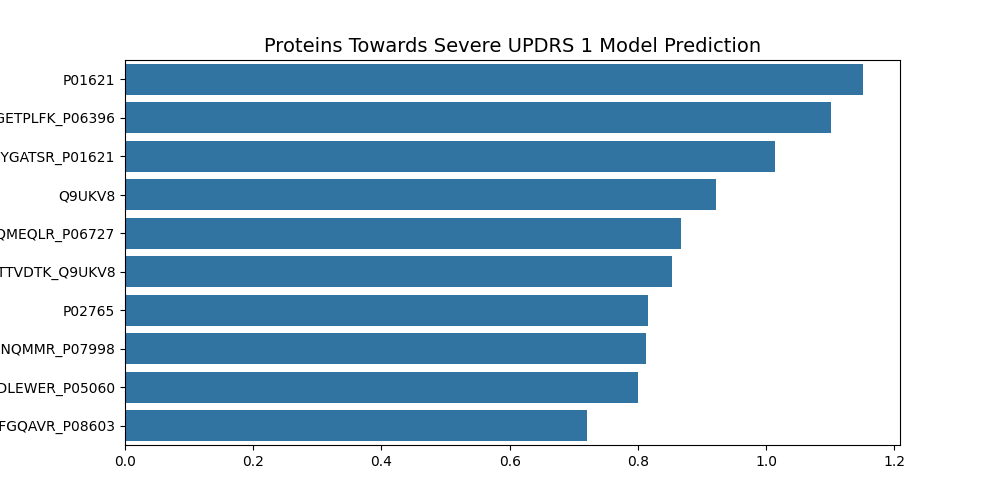
- P01621 - Immunoglobulin kappa variable 3-20
- the variable domain of immunoglobulin light chains that participates in the antigen recognition.
- P06396 - Gelsolin
- Calcium regulated, actin modulating protein that binds to the plus ends of actin monomers or filaments.
- P01621 - Immunoglobulin kappa variable 3-20
- the variable domain of immunoglobulin light chains that participates in the antigen recognition.
- Q9UKV8 - Argonaute2
- Required for RNA mediated gene splicing.
- P06707 - Apolipoprotein A-IV
- Required for efficient activation of lipoprotein lipase by Apoc-II and potent activator of LCAT.
- Q9UKV8 - Argonaute2
- Required for RNA mediated gene splicing.
- P02765 - Fetuin-A
- Counteracts the host antiviral immune response when activated and phosphorylated.
- P07998 - Ribonuclease Pancreatic
- Endonuclease that catalyzes the cleavage of RNA.
- P05060 - Secretogranin-1
- Neuroendocrine secretory granule protein.
- P08603 - Complement Factor H
- Glycoprotein that plays an essential role in maintaining a well-balanced immune response.
UPDRS 1 Summary
Three proteins/peptides are involved in RNA splicing, two are involved in immunoglobulin structure, two are involved in immune response, one in actin formation, one in lipase and one in neuroendocrine activity.
UPDRS 2 Top Ten Features
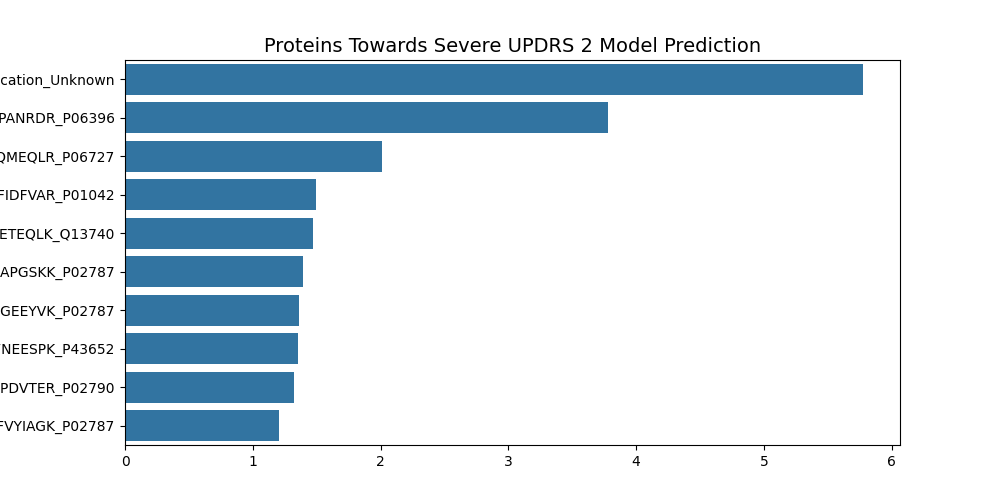
- Medication Unknown
- When the patient’s medication status is not known, it helps predict severity of UPDRS 2.
- P06396 - Gelsolin
- Calcium regulated, actin modulating protein that binds to the plus ends of actin monomers or filaments.
- P06727 - Apolipoprotein A-IV
- Required for efficient activation of lipoprotine lipase by ApoC-II and potent activator of LCAT.
- P01042 - Kinnogen-1
- Inhibitor of thiol proteases.
- Q13740 - CD166 antigen
- Promotes neurite extension, axon growth and axon guidance.
- P02787 - Serotransferrin
- Iron binding transport protein.
- P02787 - Serotransferrin
- Iron binding transport protein.
- P43652 - Afamin
- May be involved in the transport of Vitamin E across the blood brain barrier.
- P02790 - Hemopexin
- Binds heme and transports it to the liver for breakdown and iron recovery.
- P02787 - Serotransferrin
- Iron binding transport protein.
UPDRS 2 Summary
Four protien/peptides are involed in iron binding, one in actin modulation, one lipase, one protease inhibitor, one in neurite and axon growth, and one in Vitamin E transport.
UPDRS 3 Top Ten Features
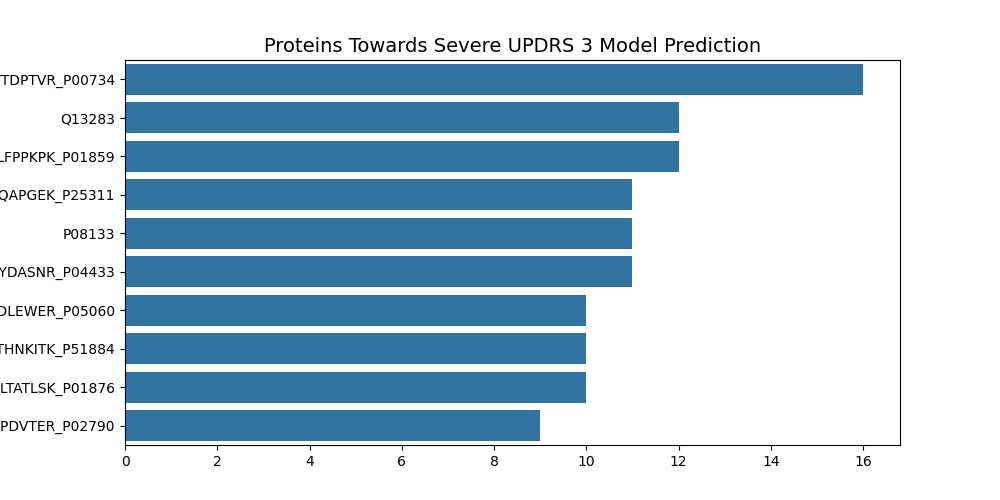
- P00734 - Prothrombin
- Converts fibrinogen to fibrin by cleaving bonds after Arg and Lys. Functions in blood homeostasis, inflammation and wound healing.
- Q13283 - Ras GTPase-activating protein-binding protein
- Involved in various processes, such as stress granule formation and innate immunity.
- P01859 - Immunoglobulin heavy constant gamma 2
- Constant region of immunoglobulin heavy chains.
- P25311 - Zinc-alpha-2-glycoprotein
- Stimulates lipid degradation in adipocytes.
- P08133 - Annexin A6
- May associate with C21 and may regulate release of Calcium from intracellular stores.
- P04433 - Immunoglobulin kappa variable 3-11
- V region of the variable domain of immunoglobulin light chains.
- P05060 - Secretogranin-1
- Neuroendocrine secretory granule protein.
- P51884 - Lumican
- Structural molecule activity.
- P01876 - Immunoglobulin heavy constant alpha 1
- Constant region of immunoglobulin heavy chains.
- P02790 - Hemopexin
- Binds heme and transports it to the liver for breakdown and iron recovery.
UPDRS 3 Summary
Three protien/peptides are involed in Immunoglobulins, one in immune response, one in iron, one lipase, one in cleavage, one in neuroendocrine activity, one in Calcium transport, and one in structural activity.
Final Summary
This a common trend of proteins groups, where Immunoglobulins, Iron transport or recovery, RNA splicing, and immune response are highly represented. These types of activities can be explored to see how it relates to Parkinson’s disease.
Furthermore, researching more into the proteins that show up in the top ten more than once, which are:
- P06396 Gelsolin
- P01621 Immunoglobulin kappa variable 3-20
- Q9UKV8 Argonaute2
- P05060 Secretogranin-1
- P02787 Serotransferrin
- P02790 Hemopexin
Growth/Next Steps
Areas for Scientific Research
Based on the Feature Importances from the different models, some areas for scientific research are Immunoglobulin response, Transferrins, RNA cleavage, and immune response. Proteins found that are involved in these biological processes were more prevalent.
Specific proteins of more interest are:
- P06396 Gelsolin
- P01621 Immunoglobulin kappa variable 3-20
- Q9UKV8 Argonaute2
- P05060 Secretogranin-1
- P02787 Serotransferrin
- P02790 Hemopexin
Improve Model Performance
While these models perform quite well, next steps would be to try to use bigger compute power to generate and train models using the combination of protein values and peptide values. Unfortunately, on our local machine this number becomes massive and is not reasonable for training times.
Another idea is to using domain knowledge to specifically find proteins that are known to interact and generate new features from that subset. This would require an expert in Parkinsons biochemistry to know which proteins and peptides are of interest. Because there are 227 unique proteins and 968 unique peptides, the amount of research into each protein and peptide would not be doable by a hobbyist.
Appendix: Footnotes
- https://www.kaggle.com/competitions/amp-parkinsons-disease-progression-prediction
- https://www.kaggle.com/competitions/amp-parkinsons-disease-progression-prediction/data
- https://en.wikipedia.org/wiki/Unified_Parkinson%27s_disease_rating_scale
- https://www.microsoft.com/en-us/research/wp-content/uploads/2017/11/lightgbm.pdf
- https://pro.arcgis.com/en/pro-app/latest/tool-reference/geoai/how-lightgbm-works.htm
- https://xgboost.readthedocs.io/en/stable/tutorials/model.html
- https://pro.arcgis.com/en/pro-app/latest/tool-reference/geoai/how-catboost-works.htm
- https://journals.plos.org/plosone/article?id=10.1371/journal.pone.0262895
- https://towardsdatascience.com/hyperopt-demystified-3e14006eb6fa
- https://hyperopt.github.io/hyperopt/
- https://xgboost.readthedocs.io/en/latest/parameter.html
- https://lightgbm.readthedocs.io/en/latest/Parameters.html
- https://catboost.ai/en/docs/concepts/python-reference_catboostclassifier